
The African Immigrant Experience in America: Insights into Income, Education, and Social Trends
The African immigrant population in the United States has grown significantly over the past few decades, bringing with it diverse cultures, skills, and contributions to American society. While often grouped together in broader discussions, African immigrants represent a wide array of experiences, backgrounds, and socio-economic outcomes depending on their country of origin.
This article delves into key socio-economic metrics—ranging from median income and educational attainment to homeownership and family dynamics—to provide a nuanced understanding of how different African immigrant communities are navigating life in America. By examining data from Ethiopia, Ghana, Nigeria, South Africa, Kenya, Somalia, and Cameroon, we uncover compelling patterns and trends that highlight both the achievements and challenges faced by these communities.
The data is sourced from the American Community Survey (ACS) 2023, specifically the Selected Population Profile (SPP), provided by the U.S. Census Bureau. The ACS is an ongoing survey that provides vital information on a yearly basis about the U.S. population and housing characteristics. The Selected Population Profile focuses on specific ethnic and national origin groups, allowing for a detailed breakdown of the African immigrant population in America.
1. Median Income (USD)
South African immigrants in America lead with the highest median household income at $107,595, followed by Kenyans at $93,568. This suggests that South Africans and Kenyans may have access to higher-paying jobs, possibly due to better educational backgrounds or specific employment sectors like technology and finance. On the other hand, Somali immigrants have the lowest median income at $50,533, highlighting potential barriers in accessing higher-wage opportunities.

This income disparity can be linked to various factors like length of stay in the U.S., professional qualifications, or differences in industries where each community predominantly works. It is also worth noting an assumption we are making here-South Africa’s high median income is due to the richest man in the world Elon Musk being from South Africa.
2. Education (Bachelor's degree or higher %)
Nigerian immigrants top the list, with an impressive 64.4% holding at least a bachelor's degree. This aligns with broader data trends indicating that Nigerian immigrants are among the most highly educated immigrant groups in the U.S. Ghanaians and South Africans also show strong educational attainment, while Somali immigrants, at 14.8%, reflect educational challenges faced by refugee populations.

Higher education levels are often associated with better economic outcomes, which correlates with higher median incomes observed in groups like Nigerians and South Africans.
3. Homeownership (%)
South African immigrants lead in homeownership at 59.9%, reflecting both economic stability and possibly longer-term residency in the U.S. Conversely, Somali immigrants have a low homeownership rate of 17.8%, which may point to economic hardships, recent arrival status, or cultural preferences.

Homeownership often indicates a sense of permanence and integration into American society. The disparity in homeownership could also stem from access to credit
4. STEM Employment (%)
South African immigrants again top the chart, with 59.3% employed in STEM and professional fields. Nigerians follow closely at 56.9%, underscoring their strong educational backgrounds in science and technology. Somali immigrants, with only 23% in these fields, might face challenges in accessing these high-paying industries.
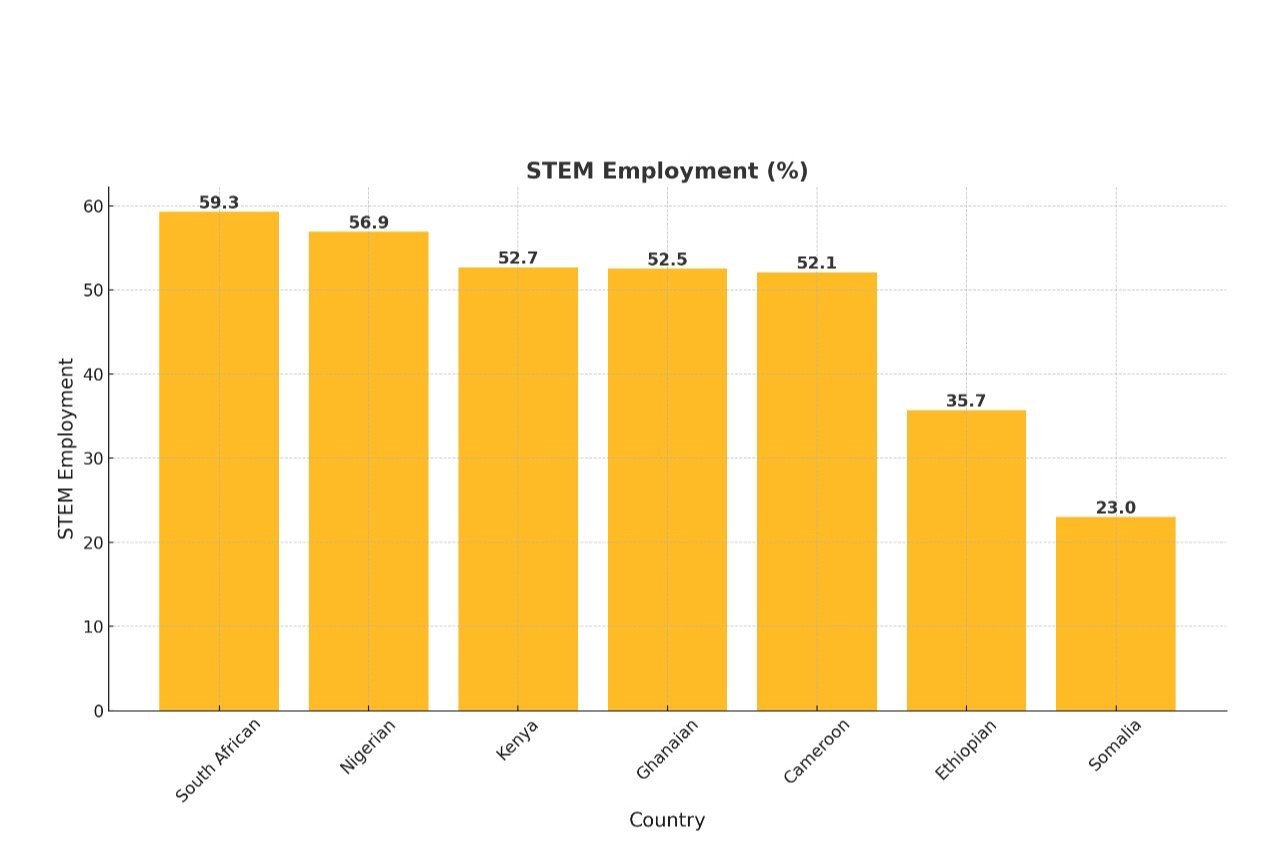
STEM employment often translates into higher income potential, which we observe with South Africans and Nigerians. This also reflects the broader trend of African immigrants contributing significantly to the U.S. tech and healthcare sectors.
5. Population Size
Nigerians form the largest African immigrant group in this dataset, with 760,079 individuals. Ethiopians and Ghanaians follow, while South Africans represent a smaller group at 85,985.

Insight:
Population size can impact political representation, cultural influence, and community resources. The large Nigerian population indicates a significant diaspora network, which often helps new immigrants with job placement and integration.
6. Old Population (65+ %)
Kenyan immigrants have the oldest population, with 8.8% aged 65 or older. This suggests a longer-established community compared to Ethiopians, who have the youngest older population at 4.8%.

An older immigrant population might indicate a settled community with established family structures, while younger populations might still be navigating early settlement stages. However, despite the age factor, there is hardly any well-known “little Kenyan” community. In Los Angeles for example, the Ethiopians have managed to pool resources together and have a well known “Little Ethiopia” in the Fairfax district.
7. Young Population (Under 5 %)
Ghanaians lead with 10.9% of their population under 5 years old, suggesting higher birth rates or recent family migration. Conversely, Somali and Cameroonian communities show very low percentages of young children.

A higher young population can signal growing family structures, while lower numbers may reflect older immigrant populations or different migration patterns (e.g., individuals migrating alone for work).
8. Divorce Rates (%)
Kenyan immigrants have the highest divorce rate at 10.7%, followed by Nigerians at 9.2%. South Africans have the lowest at 5.3%, which may reflect cultural differences regarding marriage stability.

Divorce rates can indicate stressors like cultural adaptation challenges, economic pressures, or shifting family dynamics in a new country.
9. Never Married (%)
Ethiopian and Nigerian immigrants have the highest rates of individuals who have never married, both at 41%. Somali immigrants have the lowest at 26.5%, which may reflect cultural norms encouraging early marriage.

The high rates of never-married individuals may indicate younger populations, shifting cultural expectations, or prioritization of career advancement before marriage.